Add support for pivot tables.
When the worksheet contains fraction numbers with fractional parts > 0.5 and < 0.5 and both these numbers have fraction format applied, the number with fractional part < 0.5 will have incorrect whole part.
Incorrect timestamp of a DateTime with custom number format.
Expected:
Actual:

            string inputFileName = "input.xlsx";
            if (!File.Exists(inputFileName))
            {
                throw new FileNotFoundException(String.Format("File {0} was not found!", inputFileName));
            }

            Telerik.Windows.Documents.Spreadsheet.Model.Workbook workbook;
            IWorkbookFormatProvider formatProvider = new Telerik.Windows.Documents.Spreadsheet.FormatProviders.OpenXml.Xlsx.XlsxFormatProvider();

            using (Stream input = new FileStream(inputFileName, FileMode.Open))
            {
                workbook = formatProvider.Import(input, TimeSpan.MaxValue);
            }
            string outputFilePath = "output.xlsx";

            using (Stream output = new FileStream(outputFilePath, FileMode.Create))
            {
                formatProvider.Export(workbook, output, TimeSpan.MaxValue);
            }
Process.Start(new ProcessStartInfo() { FileName = outputFilePath, UseShellExecute = true });The COUNTA function counts cells containing any type of information, including error values and empty text ("")
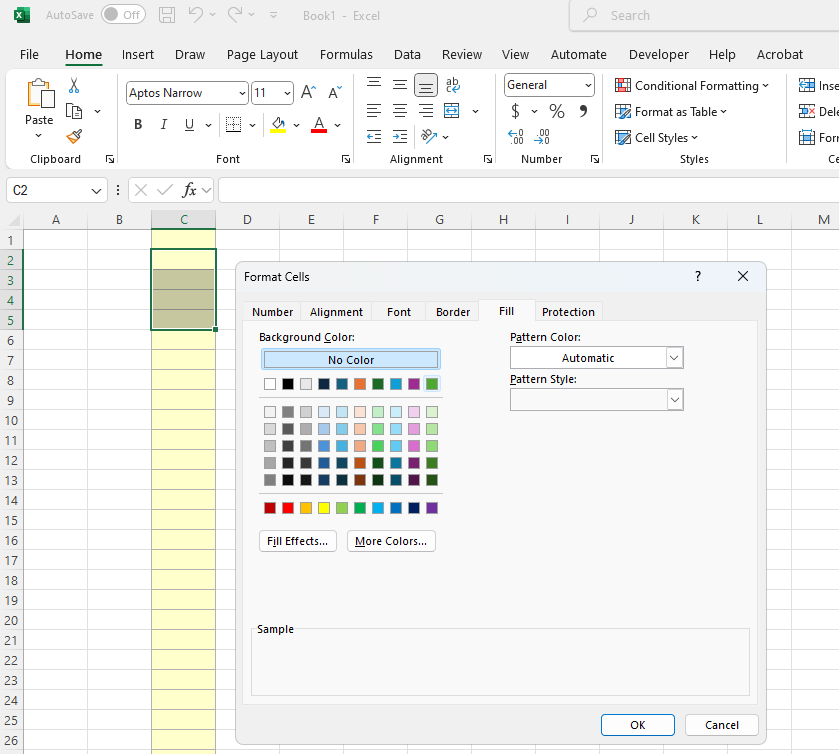
Apply Note style:

Set None Fill:
ArgumentNullException is thrown when importing a document containing a rule with no set format.

If I simply import the xls file with the XlsFormatProvider that RadSpreadProcessing offers and then export it either to xls or xlsx format, the following message pops up when opening the document in MS Excel:

The exported XLS or XLSX file with RadSpreadProcessing contains an additional <definedName>:
<?xml version="1.0" encoding="utf-8"?>
<workbook xmlns:r="http://schemas.openxmlformats.org/officeDocument/2006/relationships" xmlns="http://schemas.openxmlformats.org/spreadsheetml/2006/main">
	<sheets>
		<sheet sheetId="1" name="Sheet1" state="visible" r:id="rId1" />
	</sheets>
	<definedNames>
		<definedName name="Print_Titles" localSheetId="0" hidden="false">Sheet1!$A$1:$IV$3</definedName>
		<definedName name="_xlnm.Print_Area" localSheetId="0" hidden="false">Sheet1!$A:$G</definedName>
		<definedName name="_xlnm.Print_Titles" localSheetId="0" hidden="false">Sheet1!$1:$3</definedName>
	</definedNames>
</workbook>
Add support for creating Tables and applying tables styles (predefined ones or custom).
trying to open the attached workbook with this code:
Telerik.Windows.Documents.Spreadsheet.Model.Workbook workbook;
using (Stream input = File.OpenRead("sample.xlsx"))
{
var provider = new Telerik.Windows.Documents.Spreadsheet.FormatProviders.OpenXml.Xlsx.XlsxFormatProvider();
// The import method enables you to also pass a byte[] with the XLSX document data
workbook = provider.Import(input, TimeSpan.FromSeconds(30));
}
I get an unhandled exception:
An unhandled exception of type 'System.ArgumentNullException' occurred in Telerik.Documents.Spreadsheet.dll
Value cannot be null.
Any idea what's going on?
Thank you for your time,
Phil


Use the following code to create the document:
            Workbook workbook = new Workbook();
            Worksheet graphWorksheet = workbook.Worksheets.Add();
            FloatingChartShape chartShape = new FloatingChartShape(graphWorksheet,
                                         new CellIndex(0, 0),
                                         new CellRange(0, 0, 0, 0), ChartType.Column)
            {
                Width = 500,
                Height = 500,
            };

            graphWorksheet.Charts.Add(chartShape);
            DocumentChart chart = new DocumentChart();
            BarSeriesGroup barSeriesGroup = new BarSeriesGroup();
            barSeriesGroup.BarDirection = BarDirection.Column;
            StringChartData barCategoryData = new StringChartData(new List<string>() { "1.1", "1.2", "1.3", "1.4", "2.1", "3.1", "4.1", "4.2", "4.3" });
            IEnumerable<double> percentEvidentList = new List<double>() { Math.Round((double)0.9914 * 100, 4) , Math.Round((double)0.7719 * 100, 4), Math.Round((double)1 * 100, 4)   };
            NumericChartData barValues = new NumericChartData(percentEvidentList);
            BarSeries series = new BarSeries();
            series.Categories = barCategoryData;
            series.Values = barValues;
            ThemableColor themableColor = ThemableColor.FromArgb(255, 125, 0, 125);

            series.Fill = new SolidFill(themableColor);
            series.Title = new TextTitle("FY 20");
            barSeriesGroup.Series.Add(series);
            chart.SeriesGroups.Add(barSeriesGroup);
            ValueAxis valueAxis = new ValueAxis();
            valueAxis.Min = 0;
            valueAxis.Max = 100;
            valueAxis.NumberFormat = "0%";
            CategoryAxis categoryAxis = new CategoryAxis();
            chart.PrimaryAxes = new AxisGroup(categoryAxis, valueAxis);

            chart.Legend = new Legend();
            chart.Legend.Position = LegendPosition.Left;

            chartShape.Chart = chart;
            valueAxis.NumberFormat = "0%";
            string outputFilePath = "SampleFile.xlsx";
            File.Delete(outputFilePath);
            IWorkbookFormatProvider formatProvider = new Telerik.Windows.Documents.Spreadsheet.FormatProviders.OpenXml.Xlsx.XlsxFormatProvider();

            using (Stream output = new FileStream(outputFilePath, FileMode.Create))
            {
                formatProvider.Export(workbook, output, TimeSpan.FromSeconds(10));
            }
            Process.Start(new ProcessStartInfo() { FileName = outputFilePath, UseShellExecute = true });